Take your reporting to the next level to become a data driven enterprise
Say hello to digital documents

SINGLE VIEW
Encanvas Application Fabric makes your data composable so it’s easy to bring context to KPIs
EASY TO USE
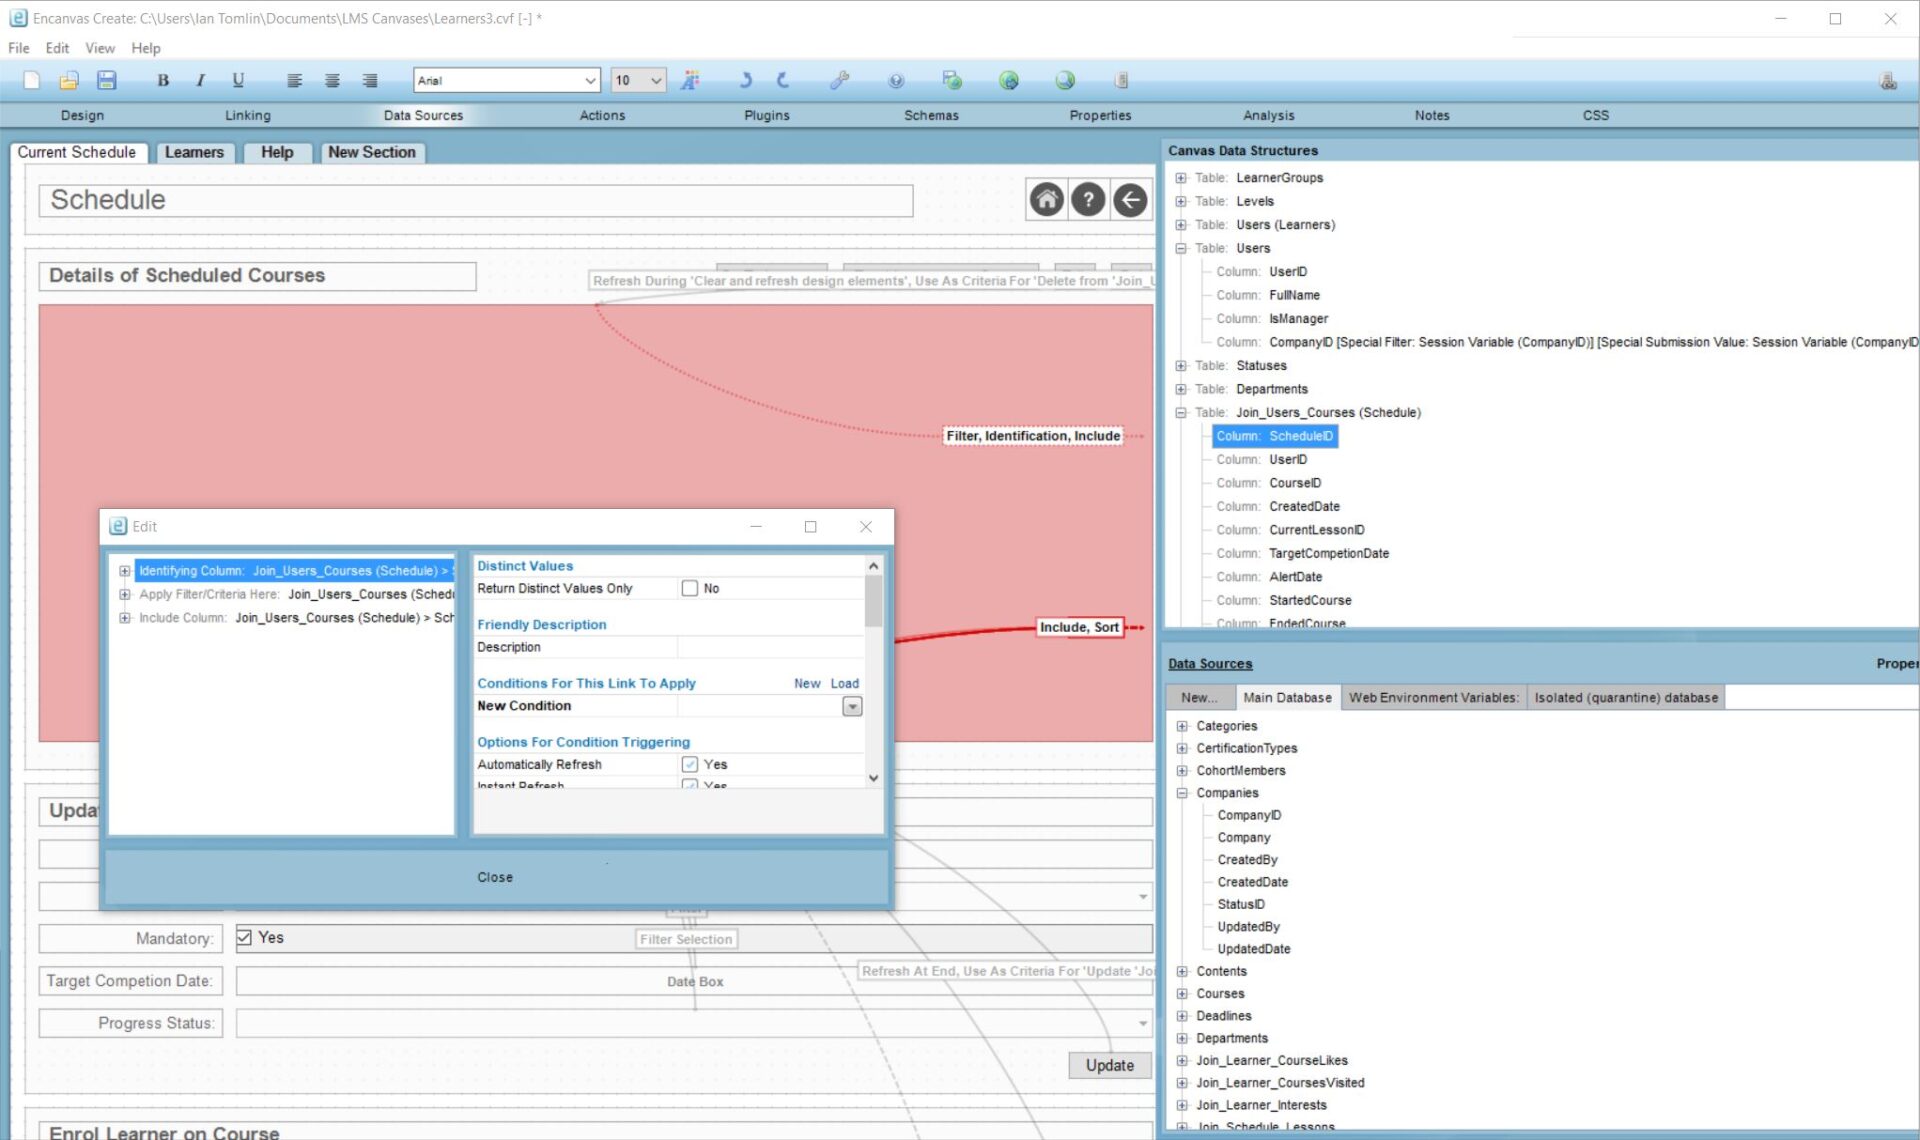
No-code tools de-skill design and publishing of your data landscapes including data mashup tools and codeless APIs
CLEVER BOTS
Our bots automate machine to machine flows, upload data, cleanse it and more!
MAPS
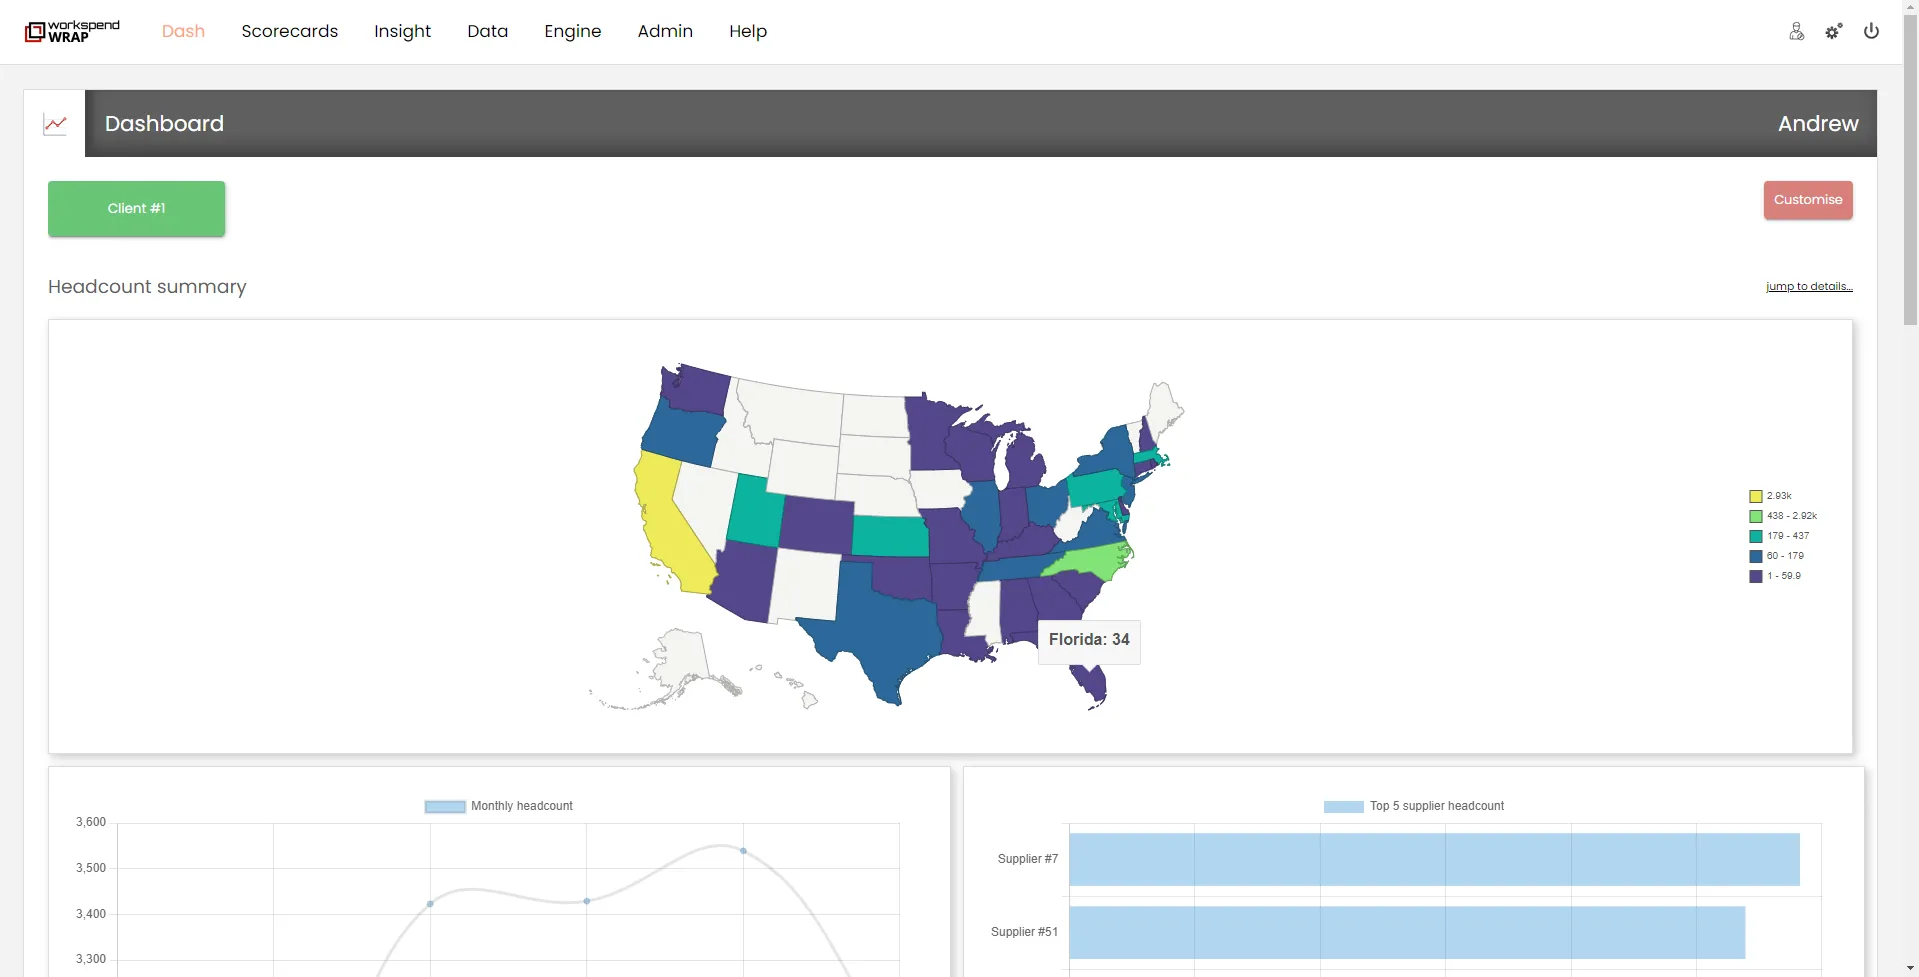
Our integrated mapping engine means you can personalize data results, pins and define areas
ALERTS
Create personalized alerts to reduce the need for managers to review dashboards
SECURE SHARING
Present your data to stakeholder groups with unique layers of data visibility and functionality
Digital Documents for Reporting
Need to make data decisions? Equip your team with the data landscapes they need to drive your business performance
Data reporting remains critical to business success, more so in the digital age. And yet, the current state of the art for reporting tools underperforms.
- Built- in reporting tools supplied by software vendors fall short on delivering context; they are unable to easily reference across other systems and data sources to bring context and clarity to performance and improvement data.
- Dashboard tools place too much workload on executives to build self-service reporting solutions and interpret data.
Digital documents make data composable. They equip decision makers with the insights they need through tooling that drills down to the detail when it’s necessary. The autonomy of design afforded by digital documents means that your team will never be short of the business performance metrics they need to drive growth.
Looking for composable data? It starts with implementing a Data Fabric
A data fabric is a middleware ecosystem used to harvest, cleanse, transform, normalize, de-dupe and organize data into a single structure. It takes Master Data Management (MDM) to a whole new level by making sure every data type has its place. Additionally, it ensures the necessary relationships between data tables exist, so you can ask anything of your data and receive a prompt reply from your analytics engine.
Encanvas Data Fabric has been deployed across industries and some of the largest global businesses to build composable data repositories that stakeholder groups can profit from, with all stakeholders sharing a single version of the truth.
A key element of Encanvas Data Fabric is our Robotic Process Automation (RPA) ecosystem Information Flow Designer. It means you can create watch folders to drag and drop uploads into, or schedule timed upload events. Additionally, it makes cloud environments safer by not needing to keep ports open for uploads.
Data Visualization? It doesn’t get better than this
Digital documents are the next generation of documents designed for the digital age. Like the hard-copy documents that precede them, they bring autonomy to your team. It means your people can work with data and publish digitally the way they want to without coding. They are an essential layer of data analytics tooling equipping digital workers with the tools to make sense of data on their terms.
Making sense of data is key to senior leaders but the last thing any department lead wants is to spend a quarter of their time building reports and mashing data. Digital documents bring us the tooling to focus on outcomes, not the process of making data useful.
Matthew Wrighton, Director of EMBU, Canon Europe (past)
Make sense of data on your terms
Digital documents bring autonomy to digital workers. They make the job of data analytics painless, rewarding …and good for business!
Data Analytics using Digital Documents
Create your data landscapes using digital landscapes.
Upload/capture
Upload data from a watch folder or scheduled event, or email. Data formats range from Excel templates, databases, etc.
Convert
Convert desktop documents (like .DOCX, .PPTX, .PDF, etc.) into digital documents. Take data structures from Excel (.XLSX) files. Auto-build new data structures.
Transform, cleanse, normalize
Use our software robots and Extract, Transform and Load (ETL) tooling to bring your data together.
Mash data
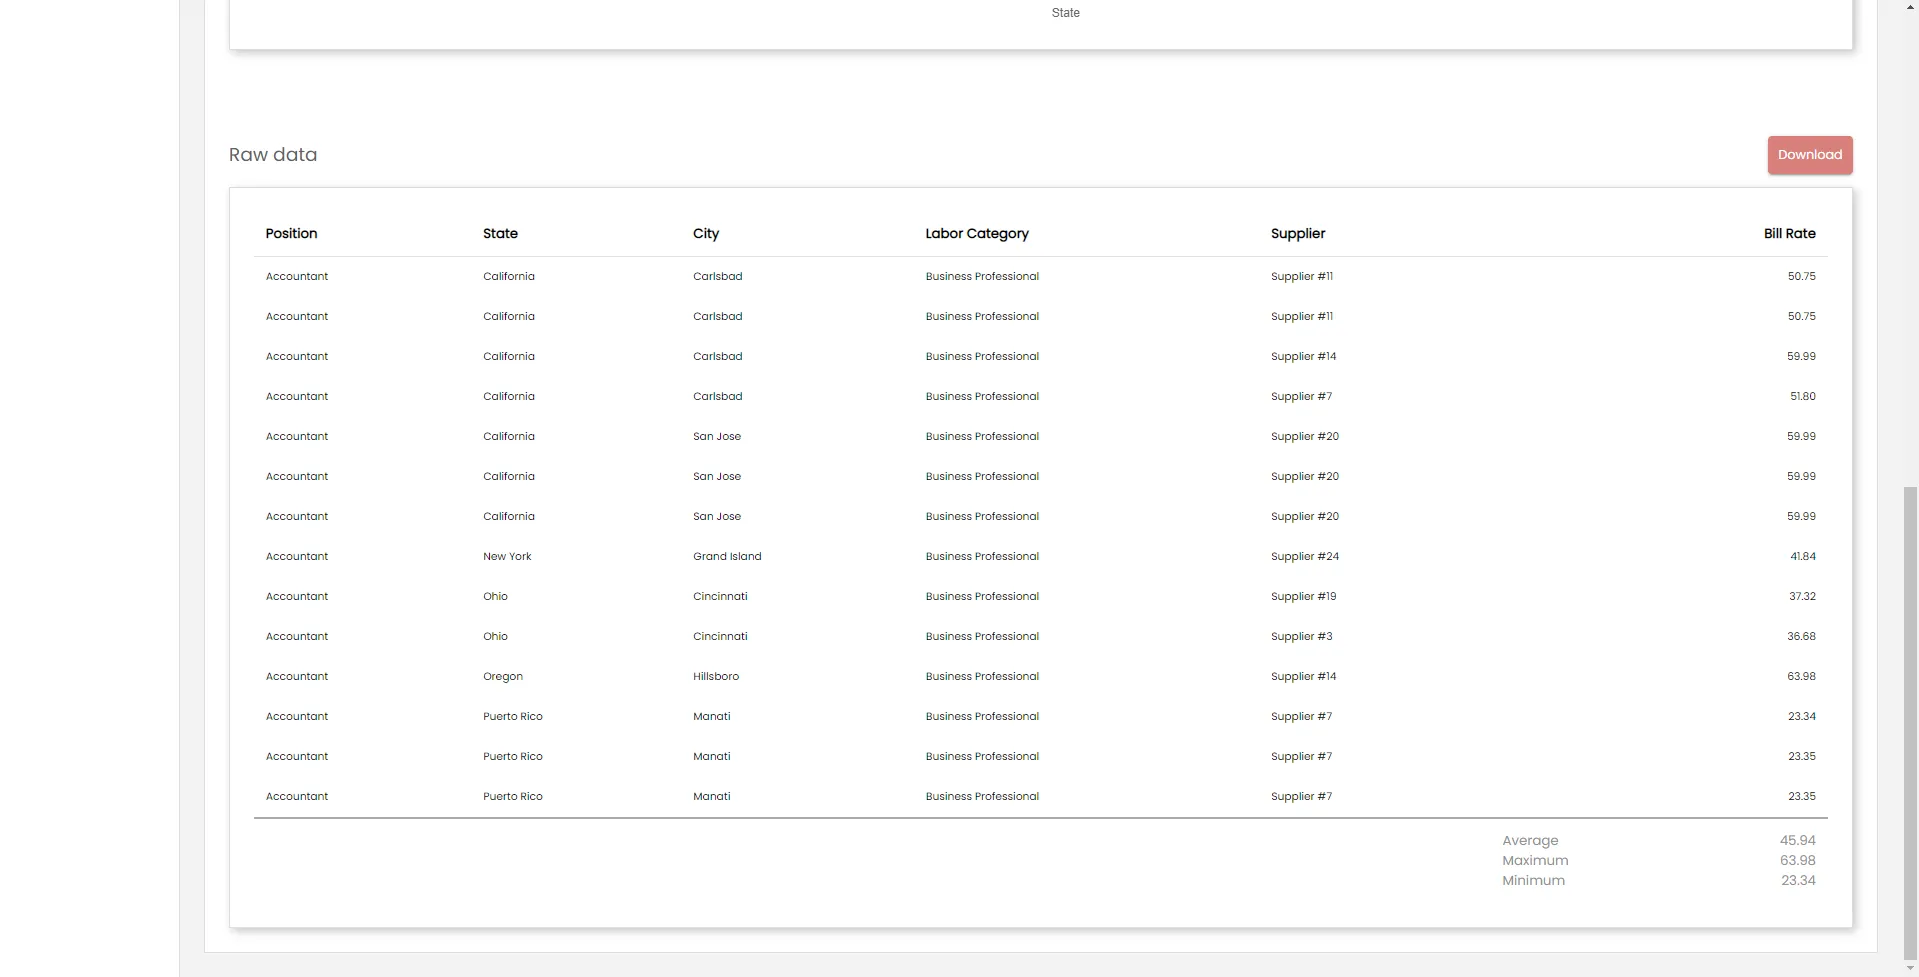
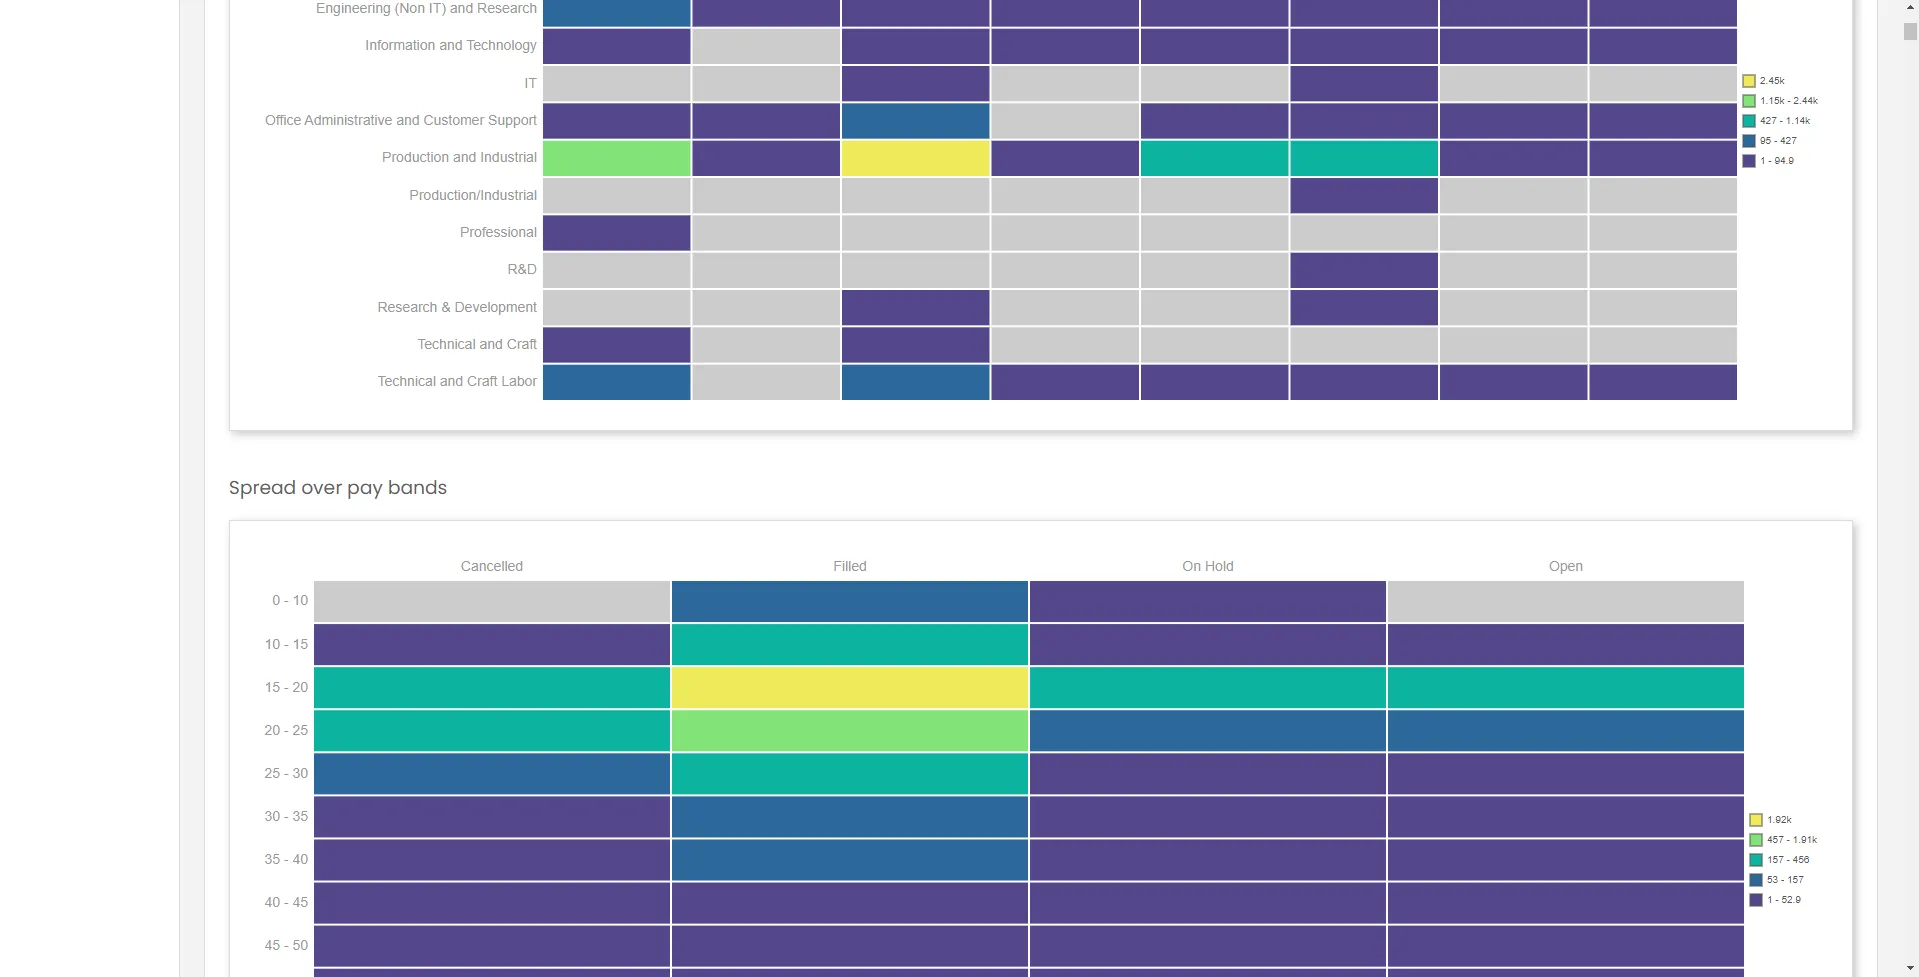
Use our no-code multi-threaded, multi-sourcing and linking tools to mash data together into new dashboards, charts and tables.
Design and build
Use our drag-and-drop design tools to build your new scorecards, reports and KPI dashboards.
Publish
One-click uploads means your designs are rapidly published to websites.
Analyze
Track page views, visits and interactions to gain an in-depth understanding of how viewers engage with your content.
Interpret
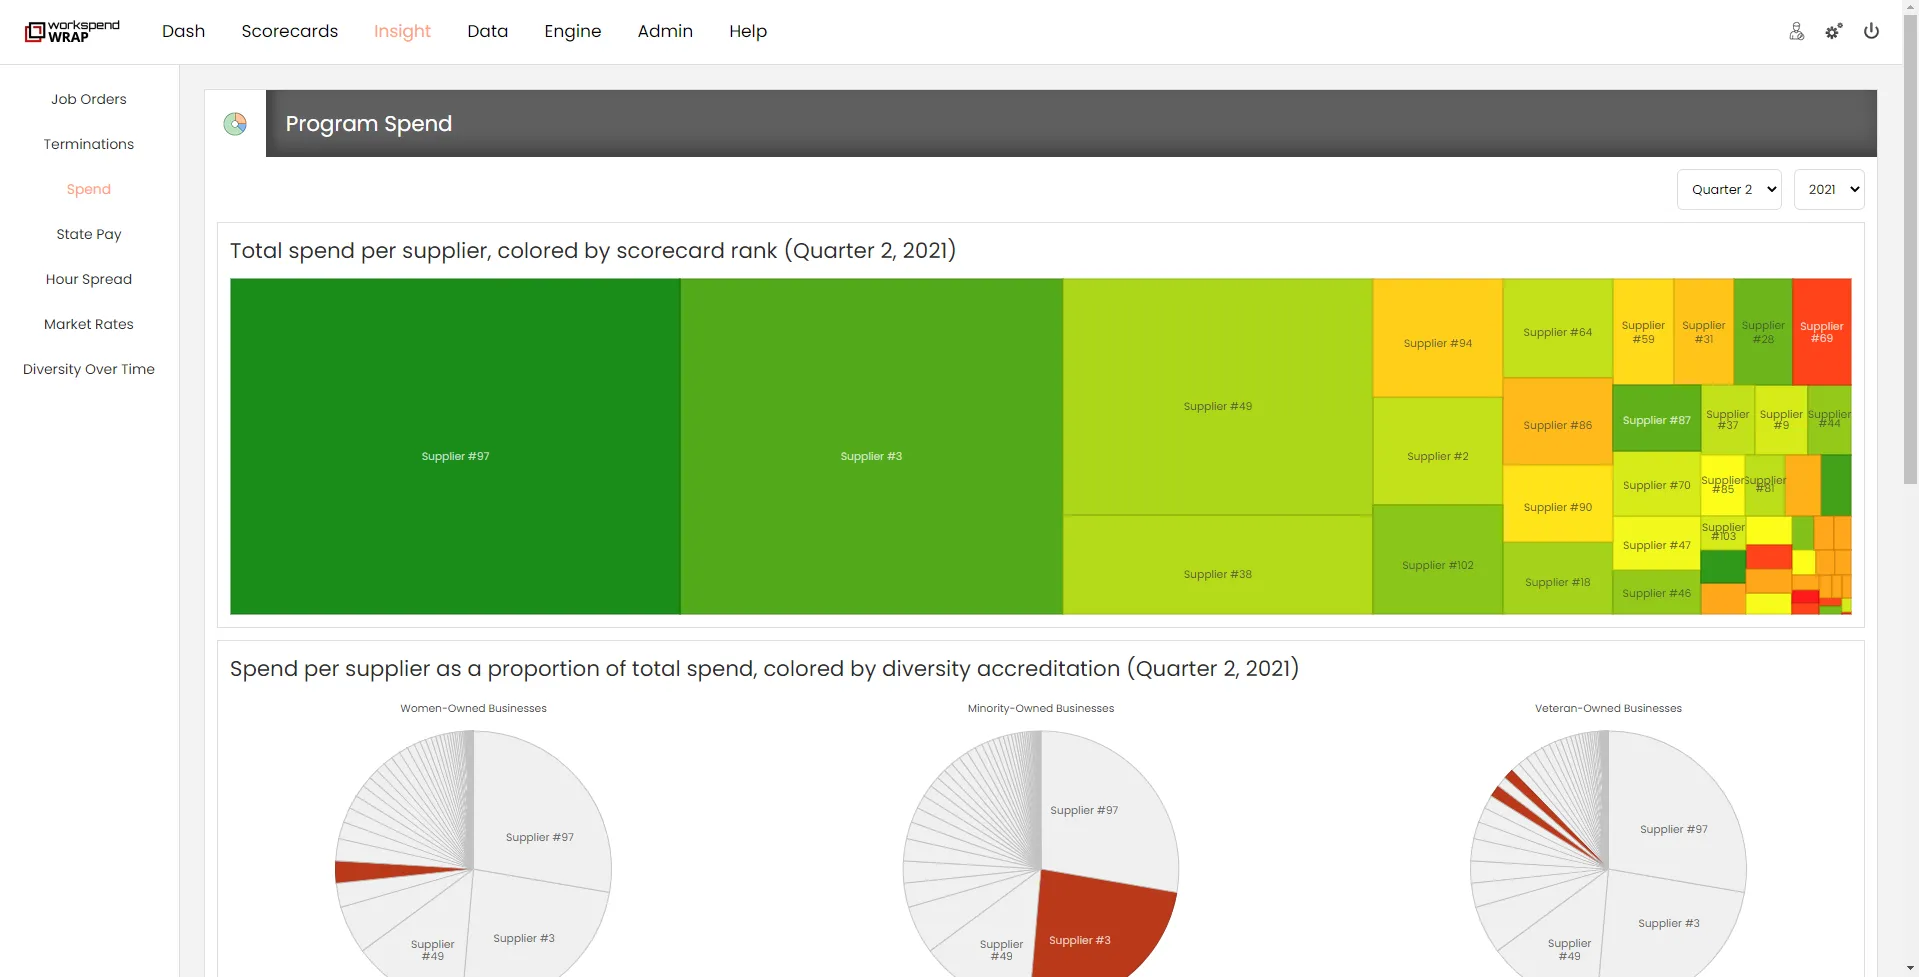
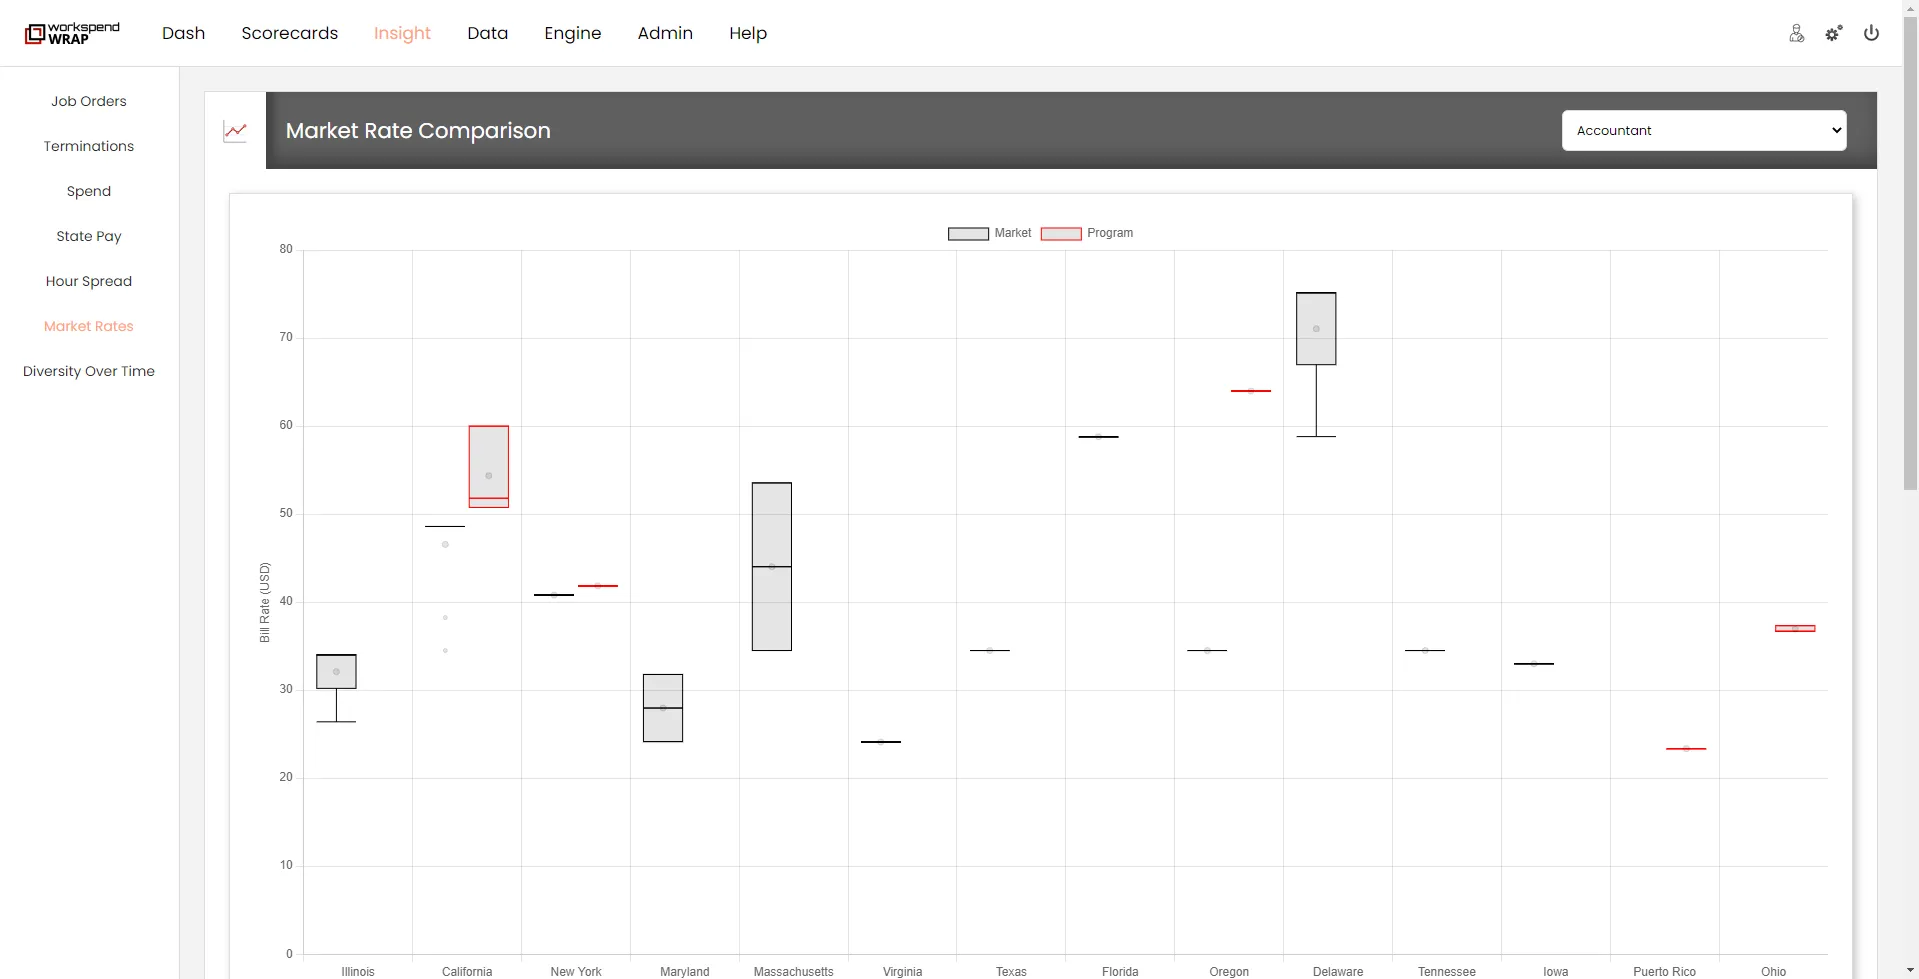
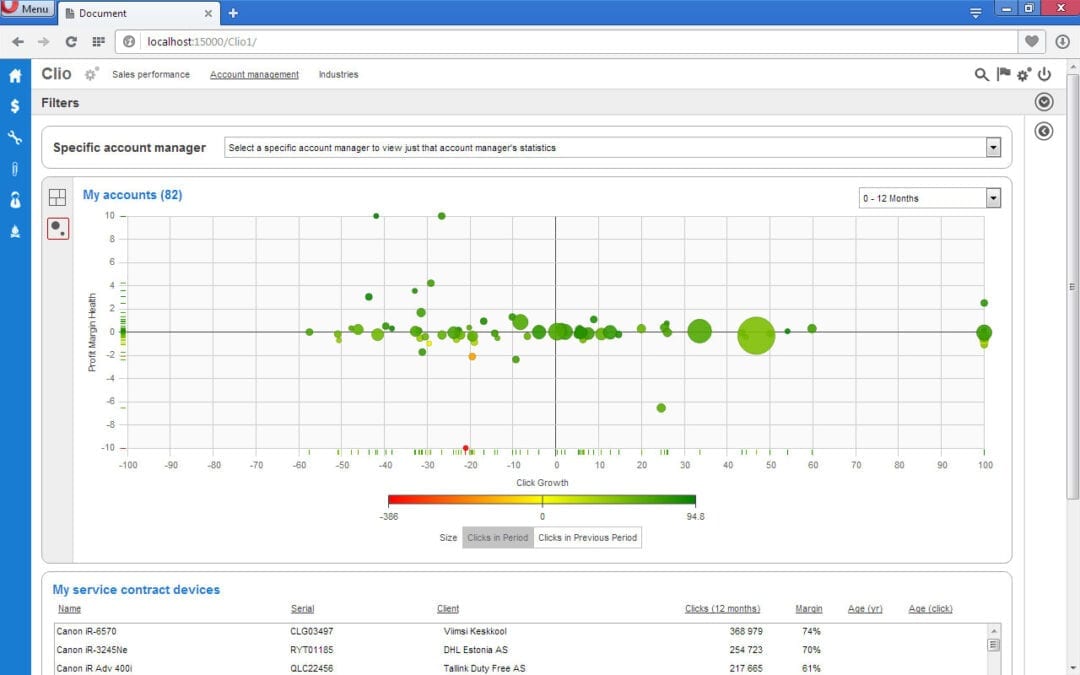
Use advanced JSON data visualization tools and geospatial maps to bring clarity to data, with drill-throughs to original source data tables.
Share
Makes it easy for you to share the reports and views. Save the views that matter most and share via email.

